Arizona Politics • Election Analysis • November 9, 2026
How Did Arizona Shift Toward Democrats in the 2026 Election?
Republicans entered the election with a significant voter registration advantage. Yet Democrats won major statewide races and gained control of the Arizona Legislature. What explains the dramatic difference?
Arizona's November 3, 2026 general election produced a significant change in the state's political landscape.
Democrats retained the governor's office, won several other statewide contests, and captured both chambers of the Arizona Legislature. The result placed the governor's office, state House, and state Senate under Democratic control simultaneously for the first time since 1966.
But perhaps the most interesting aspect of the election is what happened beneath the headline results.
Republicans had approximately 283,000 more registered voters than Democrats before the election. Yet Democratic Governor Katie Hobbs defeated Republican Andy Biggs by approximately 335,000 votes in the unofficial returns.
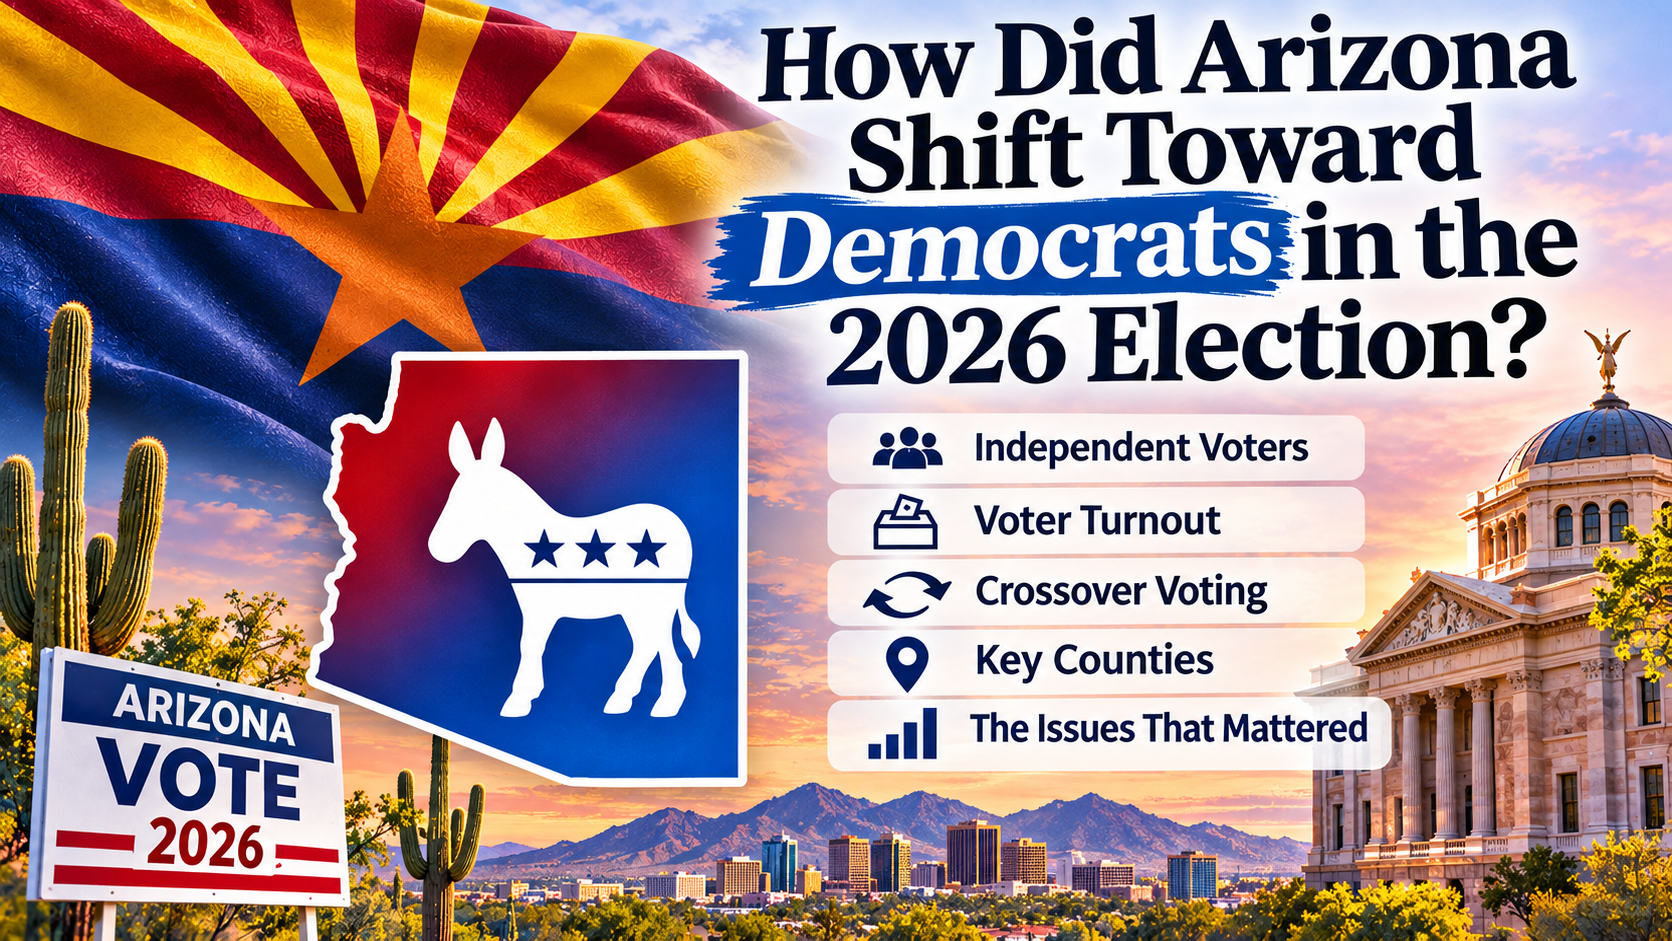
Understanding that difference requires examining independent voters, crossover voting, voter turnout, candidate preferences, and geographic voting patterns.
283,436
Republican registration advantage
~335,000
Hobbs' unofficial victory margin
34.9%
Registered as Other or unaffiliated
1. The 2026 Statewide Election Results
Democratic candidates won across multiple statewide offices, rather than relying on a single closely contested race.
| Office | Democrat | Republican | D Margin |
|---|---|---|---|
| Governor | Katie Hobbs 55.6% |
Andy Biggs 42.5% |
+13.1 |
| Secretary of State | Adrian Fontes 54.9% |
Alexander Kolodin 43.6% |
+11.3 |
| Attorney General | Kris Mayes 55.5% |
Warren Petersen 44.5% |
+11.0 |
| Treasurer | Nick Mansour 53.8% |
Elijah Norton 46.1% |
+7.7 |
| Superintendent | Teresa Leyba Ruiz 53.2% |
Kimberly Yee 46.7% |
+6.5 |
Approximate percentages from unofficial returns reported November 8, 2026. Percentage-point differences are calculated from the rounded figures shown and may differ from official margins.
The governor's race was particularly notable. Hobbs had narrowly won her first election in 2022 but received a substantially larger share of the vote in 2026.
The pattern across several offices suggests that statewide political conditions mattered, although individual candidate appeal and policy differences also influenced each contest.
2. The Voter Registration Paradox
Arizona's pre-election registration figures present one of the most revealing contrasts of the election.
Arizona Registered Voters — November 2026
Bar lengths represent percentages of total registration, not election turnout. Source: Arizona Secretary of State pre-election registration report.
Republicans represented approximately 34.8% of registered voters, Democrats approximately 28.3%, and unaffiliated or Other voters approximately 34.9%.
In other words, Arizona had more registered Republicans than Democrats, but nearly as many unaffiliated voters as Republicans.
Party registration identifies a voter's formal affiliation. It does not guarantee how that voter will vote, whether the voter will participate, or whether the voter will support every candidate from the same party.
3. Independent Voters and the Governor's Race
Independent voters were particularly important in Arizona because of their large share of the registered electorate.
A late-October Noble Predictive Insights survey found that approximately 62% of independent respondents supported Katie Hobbs in the governor's race.
Independent Support for Katie Hobbs
Share of independent respondents supporting Hobbs in the cited pre-election poll. The remaining 38% includes other preferences and responses; it should not be interpreted entirely as support for Biggs.
The same survey found strong support for Hobbs among Democrats, while Biggs retained substantial support among Republicans.
These findings help explain how Democrats could overcome the Republican registration advantage. However, polls describe sampled voter preferences, not a verified count of how every independent voted.
Independents are also not a single political bloc. Some lean conservative, others lean liberal, and many make decisions based on individual candidates or issues.
4. Did Some Republican Voters Cross Party Lines?
Survey evidence suggests that some voters who supported Donald Trump in 2024 supported Democratic candidates in 2026.
One September survey indicated that approximately 10% of respondents who reported voting for Trump in 2024 supported Hobbs in the 2026 governor's race.
That does not necessarily mean those voters became Democrats. Some may have remained conservative while making a different choice in a particular race.
Party Affiliation vs. Candidate Choice
A Republican voter may support a Democratic governor while voting Republican for Congress or the Legislature. Similarly, an independent voter may support candidates from both parties on the same ballot.
This practice, commonly called ticket splitting, is one reason election results cannot always be explained by registration numbers alone.
The available surveys suggest some crossover voting occurred, but they do not establish an exact statewide count of voters who switched from Republican to Democratic candidates.
5. Geography: Where the Votes Came From
Arizona's statewide elections are heavily influenced by Maricopa County, home to the Phoenix metropolitan area, and Pima County, which includes Tucson and much of Southern Arizona.
Unofficial county-level results illustrated how differently Arizona communities voted.
| County | Hobbs (D) | Biggs (R) |
|---|---|---|
| Maricopa | 57.1% | 41.3% |
| Pima | 64.4% | 33.7% |
| Pinal | 47.9% | 50.1% |
| Yavapai | 38.2% | 60.0% |
| Mohave | 27.1% | 70.8% |
Selected county percentages from partial post-election returns. Final county results may differ.
Maricopa County
Because Maricopa contains such a large share of Arizona's population, its election margins can substantially influence statewide outcomes. A sizable Democratic margin there can outweigh Republican victories in several less-populated counties.
Pima County
Pima County delivered a substantial Democratic margin, making Southern Arizona an important contributor to the statewide result.
Rural Arizona
Counties such as Yavapai and Mohave continued to support Republican candidates by significant margins. However, the number of votes cast in each county matters as much as the percentage won.
6. Southern Arizona: The Congressional District 6 Result
One of the most closely watched congressional races took place in Arizona's 6th Congressional District, which includes portions of Pima County and several southeastern Arizona counties.
Democratic challenger JoAnna Mendoza defeated Republican incumbent Juan Ciscomani.
Arizona Congressional District 6
188,137 votes
159,603 votes
Unofficial districtwide returns reported November 8, 2026. Other candidates account for the remaining vote share.
The district's geographic voting patterns were sharply divided. Mendoza performed strongly in the Pima County portion of the district, while Ciscomani received substantial support in Cochise and Graham counties.
The result illustrates how a congressional district combining suburban, urban, and rural communities can produce an outcome that differs from the political preferences of individual counties.
7. What Issues Influenced the Election?
Arizona voters considered a range of economic, social, and government policy issues. Surveys and reporting identified several recurring concerns:
Cost of Living
Housing affordability, household expenses, and broader economic conditions.
Immigration & Border Policy
Border security, immigration enforcement, and the economic and community effects of federal policies.
Water & Growth
Water availability, development, long-term infrastructure, and growth management.
Education & Government
School funding, public services, government accountability, and legislative priorities.
Different voters prioritized different issues. Some may have been motivated by economic concerns, others by candidate qualifications, and still others by national political developments.
The election results alone cannot establish which issue was decisive for any particular voter.
8. What Does Democratic Control Mean for Arizona?
The most consequential institutional change is Democratic control of both chambers of the Arizona Legislature alongside the governor's office.
During her previous term, Governor Hobbs frequently disagreed with the Republican-controlled Legislature, vetoing numerous bills.
With Democratic legislative majorities, the process of negotiating and passing legislation will change. Issues such as water policy, education, affordability, and state spending may now be considered under a different balance of political power.
Nevertheless, legislative control does not guarantee agreement on every proposal. Individual legislators, district interests, budget constraints, and constitutional requirements will continue to shape policymaking.
9. Has Arizona Permanently Become a Blue State?
Arizona's 2026 election demonstrates that Democratic candidates can win substantial statewide majorities even when Republicans hold a registration advantage.
However, one election does not establish that the political preferences of the electorate have permanently changed.
- Will independents continue supporting the same candidates and policy positions?
- Will voters who crossed party lines return to their previous preferences?
- Will turnout patterns remain similar in future elections?
- How will voters evaluate the policies enacted by the new Legislature?
- Will presidential and midterm electorates continue to behave differently?
Those questions require additional elections, voter surveys, and comparisons of actual voting patterns over time.
The Bottom Line
Arizona's 2026 election cannot be explained by party registration alone.
The available evidence suggests a combination of independent support for Democratic candidates, some crossover voting, differences in turnout, candidate-specific considerations, and geographic voting patterns.
The central lesson is that voter registration and actual voting behavior are not the same thing.
Republicans entered the election with approximately 283,000 more registered voters than Democrats, yet the Democratic governor won by approximately 335,000 votes. The contrast illustrates why understanding Arizona elections requires looking beyond party labels to the voters who participate and the choices they make.
Sources & Further Reading
- Arizona Secretary of State — Election Information
- Arizona Secretary of State — Election Results and Data
- Arizona Citizens Clean Elections Commission
- Noble Predictive Insights — Arizona Polling Research
- Associated Press — Arizona News and Election Coverage
Editorial note: This article discusses the November 3, 2026 election using unofficial returns reported through November 8, pre-election voter registration figures, polling, and published reporting. Results may change during certification. Polling estimates are not verified individual voting records. Interpretations of voter behavior are analytical rather than official election findings.